

Head office
Archdeacon House
Northgate Street
Ipswich
IP1 3BX
01473 927 365
Woodbridge Office
28 Church Street
Woodbridge
Suffolk
IP12 1DH
01394 388 488
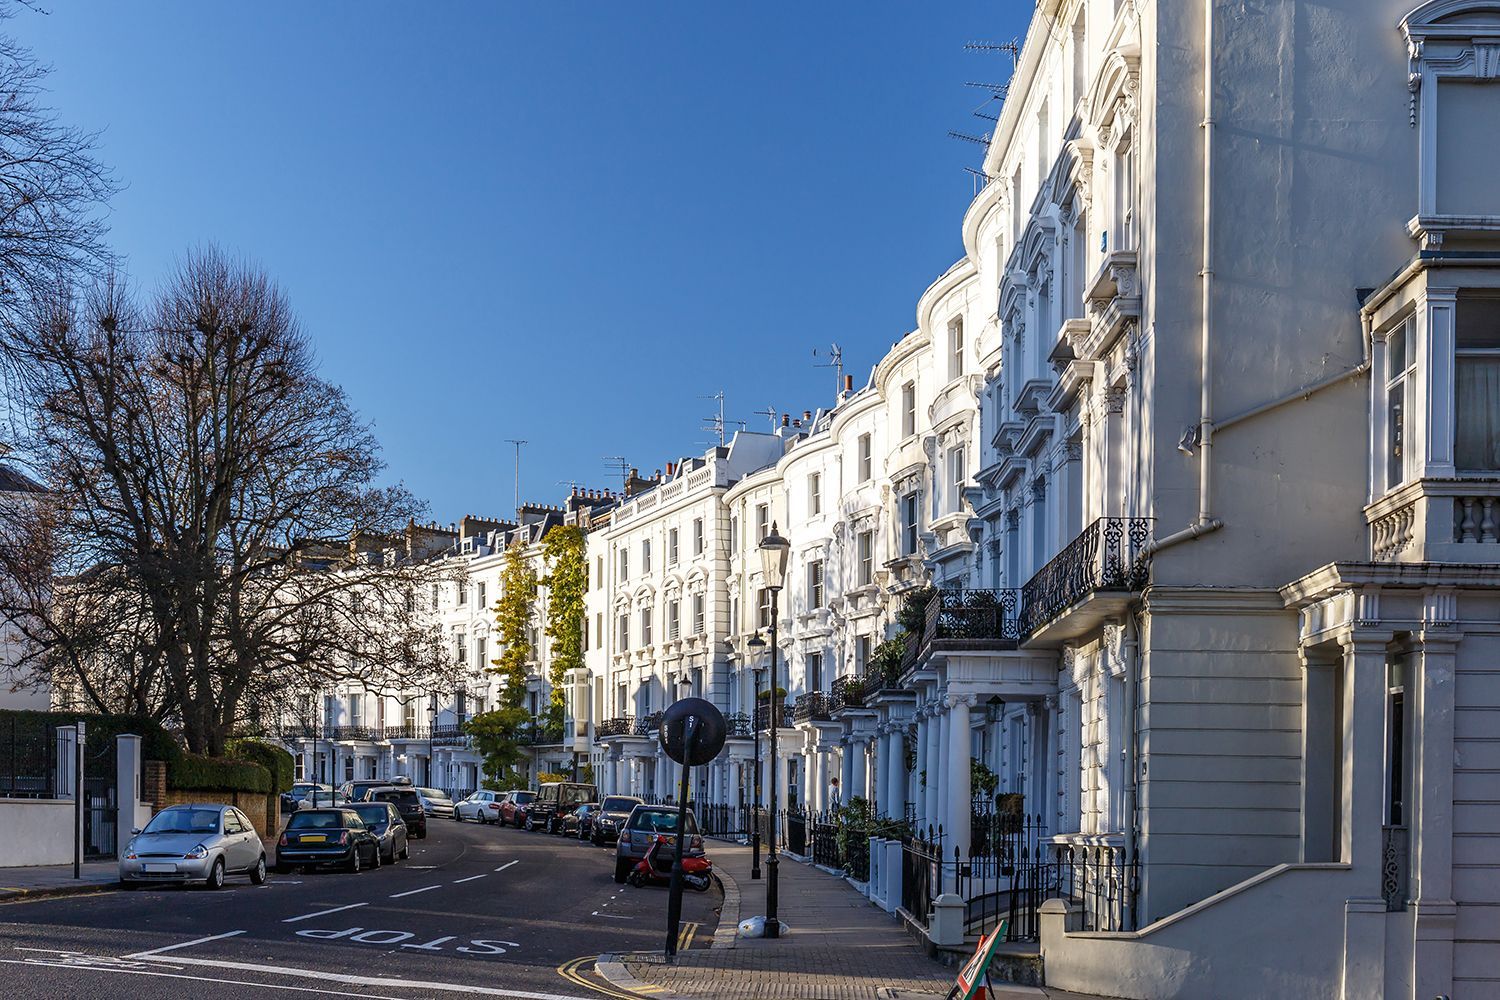
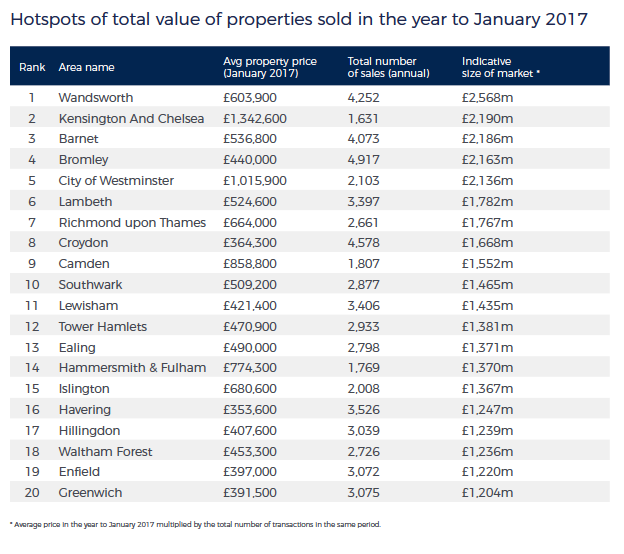
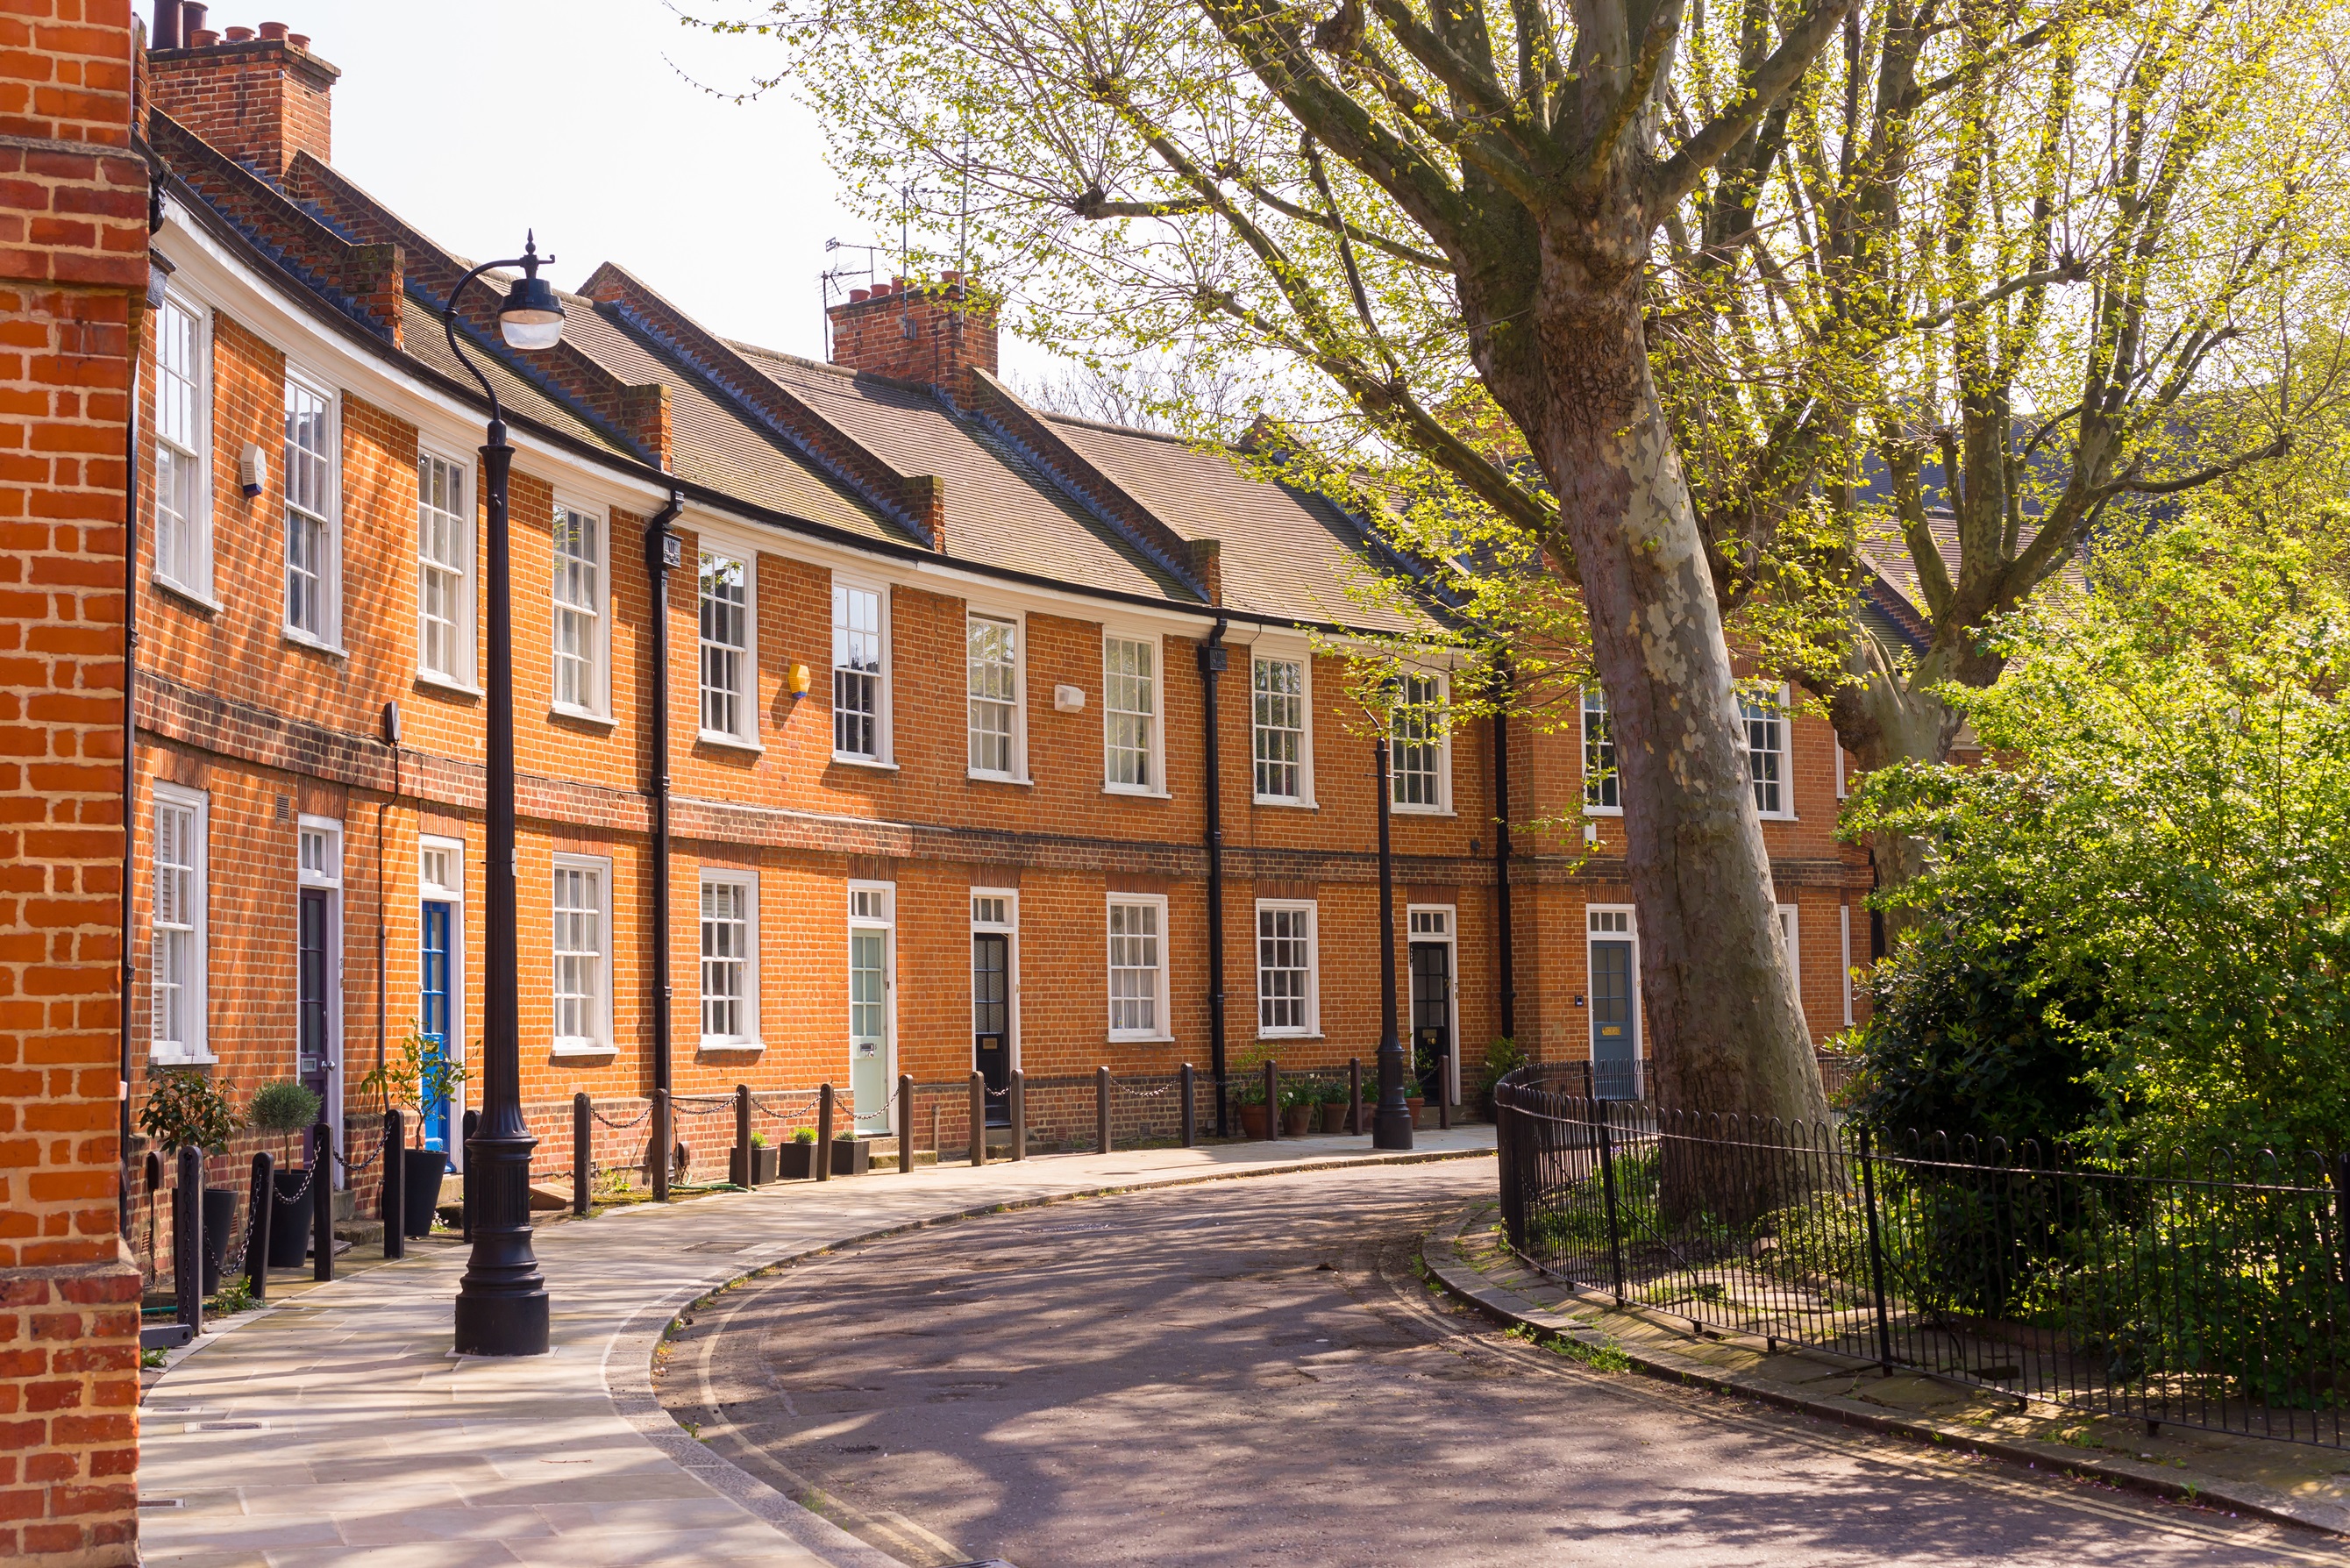
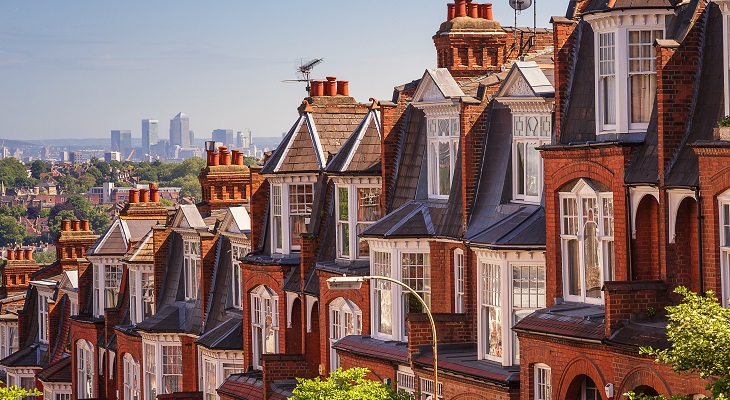
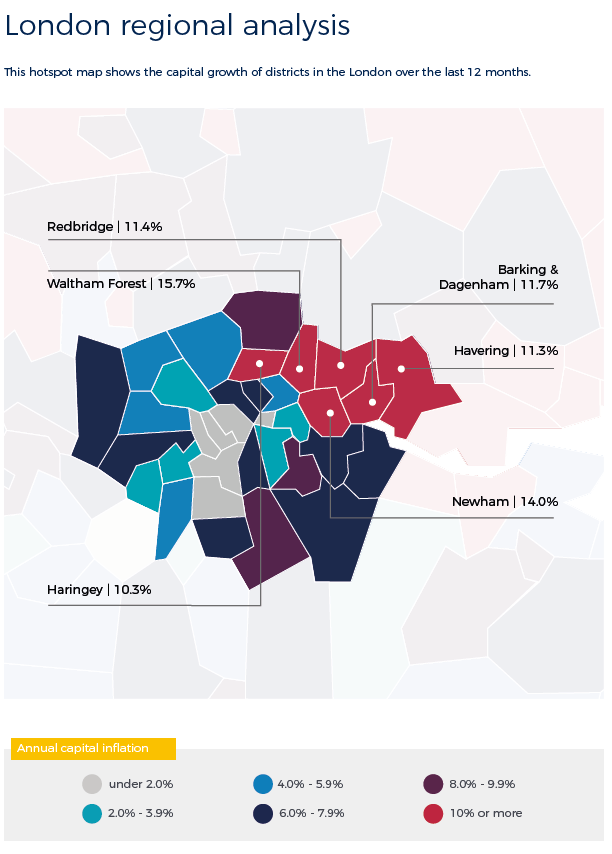
Market snapshot:
Where have house prices increased the most? Here are five districts with the highest annual capital growth.
Find your nearest
Guild Member agent and start your property search today.
Archdeacon House
Northgate Street
Ipswich
IP1 3BX
01473 927 365
28 Church Street
Woodbridge
Suffolk
IP12 1DH
01394 388 488
5 & 6 Crescent Stables
Upper Richmond Road
Putney
London
SW15 2TN
020 4524 9345
Poplar Hall Barn
Low Road
Debenham
Suffolk
IP14 6BS
01449 723 500
Established in 2020, Halls + Halls offers 40 years’ of expertise in the real estate industry. Our team provides an easy to understand, non-negotiable fixed fee product to sell property.